The $48,000 mistake: what a price cut costs a California home seller
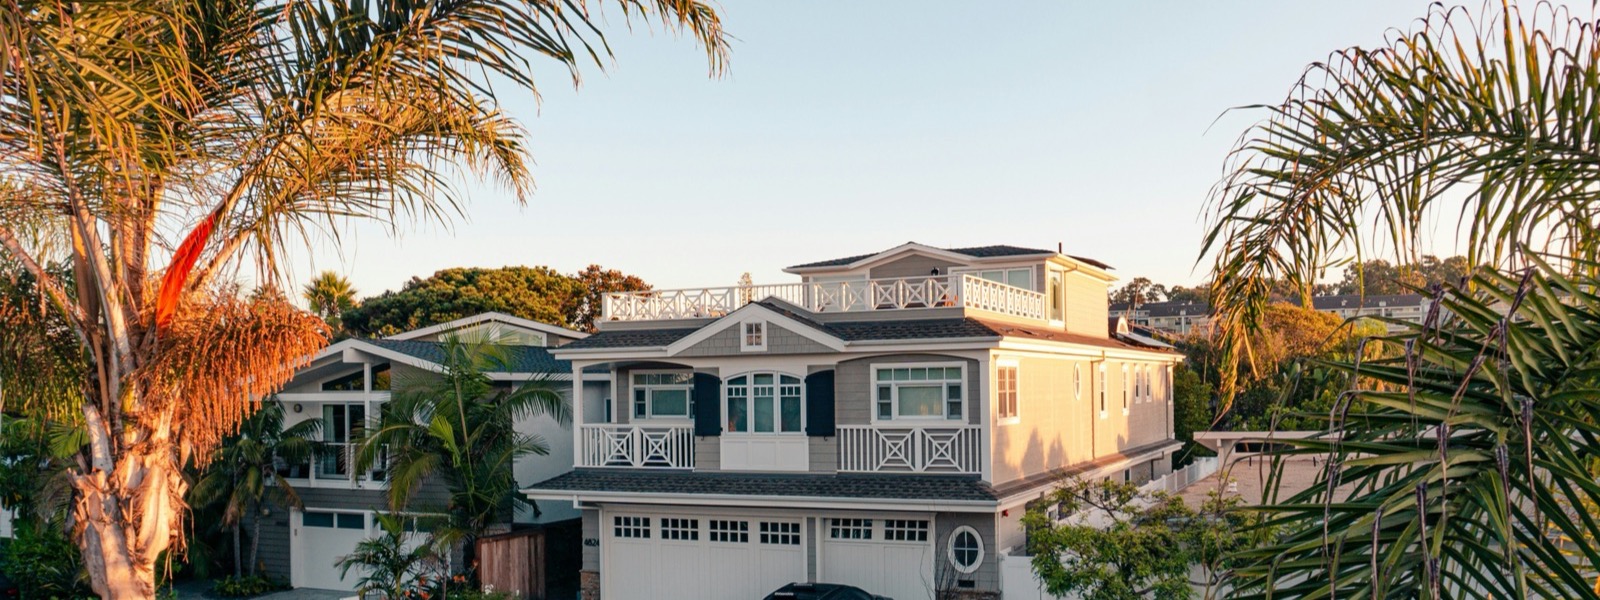
Priced right vs. had to cut
| Priced right (never cut) | Had to cut | |
|---|---|---|
| Share of sales | 66.4% | 33.6% |
| Median days to accepted offer | 14 days | 76 days |
| Sold vs. original asking (median) | 100% | 93.5% |
| Sold at or above original asking | 60.9% | 3.7% |
| Median gap vs. original asking | $0 | −$48,000 |
The cut doesn't rescue the sale. Homes that cut still took about 5× longer to go under contract, and only about 1 in 27 ever recovered to the original asking price. Overpricing isn't a "test the market" strategy; it's a measurable five-figure mistake. If you're setting a price now, start with how to price your home to sell fast.
One more number worth knowing: 8.3% of California sales — about 1 in 12 — were delisted and relisted before selling. Our day counts are cumulative, so the clock keeps running through a relist; counters that reset would show those homes as fresh listings.
Where a price cut costs the most
Every California city with at least 400 sales in the last 12 months. "Days" are median days to an accepted offer; "cost of a cut" is the median gap between original asking and final sale price among homes that cut.
| City | Sales | Cut rate | Days (never cut) | Days (cut) | Median cost of a cut | Median price |
|---|---|---|---|---|---|---|
| Los Angeles | 3,397 | 34.1% | 22 days | 91 days | $87,000 | $810,000 |
| Long Beach | 2,383 | 30.3% | 13 days | 75 days | $55,000 | $910,000 |
| Riverside | 2,311 | 34.6% | 13 days | 68 days | $35,000 | $660,000 |
| Irvine | 1,938 | 38.7% | 18 days | 74 days | $125,000 | $1,505,000 |
| Menifee | 1,555 | 37.2% | 15 days | 69 days | $27,000 | $575,000 |
| Corona | 1,415 | 38% | 15 days | 80 days | $40,000 | $750,000 |
| Huntington Beach | 1,387 | 30.2% | 12 days | 72 days | $90,000 | $1,350,000 |
| Hemet | 1,329 | 36% | 18 days | 78 days | $21,480 | $430,000 |
| Murrieta | 1,319 | 42.4% | 14 days | 70 days | $34,000 | $680,000 |
| Lancaster | 1,298 | 37.4% | 19 days | 71 days | $20,000 | $470,000 |
| San Bernardino | 1,243 | 30.7% | 16 days | 72 days | $25,000 | $515,000 |
| Victorville | 1,234 | 34.4% | 17 days | 81 days | $20,050 | $435,000 |
| Ontario | 1,180 | 36% | 17 days | 62 days | $27,230 | $655,000 |
| Moreno Valley | 1,166 | 30.1% | 14 days | 55 days | $24,900 | $550,000 |
| Fontana | 1,149 | 32.6% | 14 days | 65 days | $26,480 | $650,000 |
| Temecula | 1,121 | 39.3% | 13 days | 70 days | $42,500 | $770,000 |
| Rancho Cucamonga | 1,078 | 33.4% | 14 days | 65 days | $45,500 | $780,000 |
| Anaheim | 1,073 | 27.2% | 12 days | 60 days | $44,000 | $915,000 |
| Apple Valley | 1,066 | 43.5% | 17 days | 83 days | $25,000 | $438,000 |
| Hesperia | 988 | 37.2% | 19 days | 72 days | $21,066 | $470,000 |
| Palmdale | 977 | 34% | 20 days | 75 days | $29,900 | $522,000 |
| Pasadena | 976 | 22.3% | 16 days | 79 days | $100,000 | $1,275,000 |
| Torrance | 909 | 25.1% | 11 days | 62 days | $65,000 | $1,095,000 |
| Chico | 890 | 36.5% | 9 days | 65 days | $33,500 | $468,000 |
| Mission Viejo | 882 | 32.4% | 10 days | 58 days | $70,000 | $1,215,000 |
| Orange | 871 | 29.6% | 11 days | 59 days | $78,944 | $1,158,000 |
| Santa Ana | 851 | 26.8% | 15 days | 70 days | $50,000 | $859,900 |
| Bakersfield | 823 | 34.4% | 17 days | 64 days | $23,000 | $399,000 |
| Whittier | 822 | 26.2% | 12 days | 67 days | $46,000 | $840,000 |
| Valencia | 800 | 41.9% | 14 days | 77 days | $45,000 | $805,000 |
| Lake Elsinore | 796 | 39.9% | 17 days | 72 days | $25,000 | $590,000 |
| Merced | 766 | 41% | 15 days | 66 days | $24,900 | $401,367 |
| Fullerton | 751 | 25.2% | 10 days | 62 days | $55,000 | $1,050,000 |
| Lake Forest | 735 | 32.5% | 12 days | 72 days | $85,000 | $1,235,000 |
| Oxnard | 711 | 29.8% | 16 days | 78 days | $54,950 | $790,000 |
| Ventura | 706 | 35.6% | 17 days | 82 days | $64,000 | $875,075 |
| Winchester | 676 | 46.2% | 17 days | 59 days | $19,850 | $615,994 |
| Perris | 659 | 30.8% | 14 days | 63 days | $24,000 | $575,000 |
| Chino | 658 | 35.3% | 17 days | 70 days | $41,000 | $755,000 |
| Laguna Niguel | 638 | 32.6% | 11 days | 66 days | $99,000 | $1,394,000 |
| Beaumont | 635 | 41.3% | 13 days | 78 days | $22,146 | $530,000 |
| Redlands | 621 | 37.4% | 13 days | 75 days | $33,000 | $658,000 |
| Yorba Linda | 619 | 31.2% | 10 days | 67 days | $85,000 | $1,325,000 |
| San Clemente | 611 | 33.4% | 10 days | 74 days | $149,748 | $1,760,000 |
| Newport Beach | 607 | 33.9% | 16 days | 104 days | $397,000 | $3,400,000 |
| Redondo Beach | 595 | 29.4% | 12 days | 84 days | $129,000 | $1,600,000 |
| Glendale | 587 | 23.7% | 14 days | 67 days | $99,999 | $1,250,000 |
| Camarillo | 586 | 36.9% | 14 days | 74 days | $50,000 | $868,000 |
| Garden Grove | 577 | 18.7% | 11 days | 60 days | $62,488 | $1,015,000 |
| Pomona | 568 | 30.8% | 17 days | 82 days | $40,000 | $663,500 |
| Laguna Woods | 559 | 40.6% | 14 days | 81 days | $39,000 | $440,000 |
| Upland | 553 | 35.4% | 13 days | 62 days | $51,944 | $810,000 |
| Paso Robles | 547 | 37.1% | 12 days | 82 days | $58,000 | $765,000 |
| Jurupa Valley | 542 | 32.3% | 13 days | 64 days | $25,000 | $688,272 |
| San Jacinto | 540 | 33% | 22 days | 58 days | $14,000 | $500,000 |
| Costa Mesa | 523 | 29.4% | 10 days | 62 days | $145,000 | $1,515,000 |
| Rialto | 506 | 29.1% | 13 days | 61 days | $19,578 | $589,754 |
| Santa Maria | 505 | 28.3% | 7 days | 54 days | $34,000 | $685,000 |
| Canyon Country | 497 | 38.6% | 16 days | 75 days | $37,000 | $765,000 |
| Banning | 495 | 42.8% | 16 days | 97 days | $24,700 | $430,000 |
| San Pedro | 490 | 33.7% | 14 days | 82 days | $55,500 | $837,000 |
| Chino Hills | 488 | 27.5% | 14 days | 68 days | $69,500 | $1,001,000 |
| Lake Arrowhead | 486 | 50.4% | 27 days | 130 days | $81,000 | $611,000 |
| Woodland Hills | 481 | 31.8% | 15 days | 81 days | $120,500 | $1,155,025 |
| Burbank | 472 | 27.8% | 14 days | 80 days | $100,000 | $1,236,500 |
| Arcadia | 466 | 22.7% | 17 days | 80 days | $142,000 | $1,475,000 |
| Saugus | 465 | 40.6% | 14 days | 73 days | $40,000 | $820,000 |
| Rancho Santa Margarita | 462 | 36.8% | 13 days | 69 days | $50,388 | $1,060,000 |
| San Luis Obispo | 456 | 30.9% | 9 days | 78 days | $99,900 | $1,087,170 |
| Seal Beach | 451 | 31.7% | 14 days | 71 days | $36,000 | $430,000 |
| Lakewood | 450 | 24.9% | 9 days | 55 days | $51,694 | $899,450 |
| West Covina | 446 | 22.2% | 12 days | 66 days | $58,000 | $850,000 |
| Oroville | 440 | 41.6% | 16 days | 100 days | $28,900 | $315,000 |
| Compton | 424 | 23.6% | 19 days | 74 days | $36,500 | $650,000 |
| Yucaipa | 423 | 33.1% | 11 days | 72 days | $34,450 | $595,000 |
| Tustin | 417 | 28.5% | 12 days | 64 days | $73,000 | $1,215,000 |
| Eastvale | 415 | 30.8% | 12 days | 72 days | $55,500 | $920,000 |
| Simi Valley | 404 | 34.9% | 15 days | 61 days | $45,000 | $811,000 |
City links go to that city's agent directory, where every agent's price-reduction rate is published.
The agent connection
Pricing skill is measurable per agent. Ranked agents who rarely cut price average 40 days on market at 102.8% of list; agents who often cut average 79 days at 97.8%. Before you hire, check the price-reduction rate on any agent's profile, or start with the fewest-price-cuts rankings — and see the overpricing trap for how agents' pricing patterns differ.
Methodology
Recorded California residential sales closed in the trailing 12 months (n=105,811). A price cut means the final asking price was below the original asking price. Days on market are cumulative to the accepted offer — delisting and relisting does not reset the count (it resets only after 90+ consecutive days off market). Sales recorded with zero market time (off-market or pre-arranged) are excluded from time statistics. Medians throughout; sales under $50K and over $20M excluded. Details: how this site works.
Keep reading

How to Price Your Home to Sell Fast (and for More)
A data-backed method for setting your list price: what priced-right homes have in common, why small cuts don’t fix big misses, and the three-week rule.

How Long Does It Take to Sell a House in California? (2026 Data)
Median days to an accepted offer across California cities, and why priced-right homes sell five times faster than homes that need a cut.
The Best Month to Sell a House in California, From 330,000 Sales
Month-by-month closed-sale outcomes — days to offer, price-cut rates, and sale-to-ask — showing when California listings do best.
Skip the guesswork
Find an agent whose own record shows they rarely need a cut — free, based on the same data.
Frequently asked questions
Does cutting the price fix an overpriced listing?
Not really. Homes that cut still took a median 76 days to go under contract — versus 14 days for homes that never cut — and closed at 93.5% of the original asking price. Only 3.7% of cut homes ever recovered to their original ask.
How common are price cuts in California?
33.6% of California homes sold in the last 12 months cut their asking price before selling — roughly one in three. The rate varies by city, from about 18.7% to over 40%.
What does a price cut cost the seller?
The median cut home closed $48,000 below its original asking price. In higher-priced markets the gap is larger — well into six figures in cities like Irvine and Pasadena.
Can I avoid needing a price cut?
Mostly, yes — pricing to the market on day one is the single biggest controllable. See our data-backed guide to pricing your home, and check any agent’s price-reduction rate on their profile before you hire them.