Sale-to-list ratios across California cities
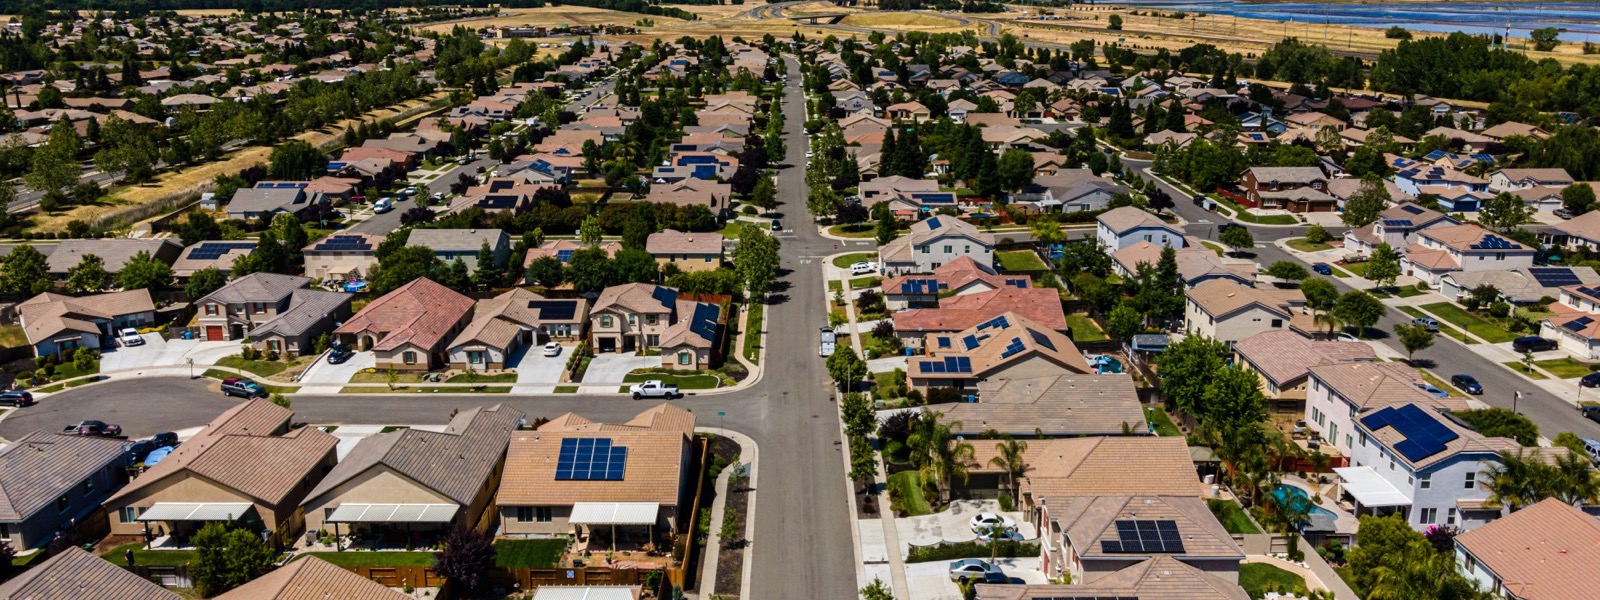
Where homes sell over asking
| City | Sales (24mo) | Median DOM | Sale ÷ list | Listings cut |
|---|---|---|---|---|
| South Pasadena | 317 | 18 days | 105.3% | 15% |
| Newhall | 481 | 30 days | 104.3% | 34% |
| La Crescenta | 314 | 19 days | 103.7% | 19% |
| Brea | 670 | 15 days | 103.5% | 22% |
| Monrovia | 504 | 22 days | 103% | 20% |
| La Canada Flintridge | 344 | 19 days | 102.8% | 17% |
| Pasadena | 2,054 | 24 days | 102.5% | 19% |
| Crestline | 567 | 54 days | 102.4% | 45% |
| San Gabriel | 455 | 18 days | 102.3% | 24% |
| Rosemead | 370 | 19 days | 102.1% | 22% |
Where buyers have leverage
| City | Sales (24mo) | Median DOM | Sale ÷ list | Listings cut |
|---|---|---|---|---|
| Joshua Tree | 527 | 94 days | 92.6% | 40% |
| California City | 418 | 73 days | 92.6% | 40% |
| Aguanga | 338 | 111 days | 93.2% | 43% |
| Lucerne Valley | 501 | 81 days | 93.4% | 32% |
| Cambria | 320 | 49 days | 93.5% | 38% |
| Clearlake | 437 | 71 days | 93.6% | 39% |
| 29 Palms | 804 | 73 days | 93.8% | 43% |
| Kelseyville | 427 | 84 days | 93.8% | 45% |
| Paradise | 1,526 | 61 days | 94.7% | 34% |
| Magalia | 403 | 72 days | 94.8% | 48% |
Cities with at least 300 closed sales in the last 24 months. Sale ÷ list uses final list price. Methodology.
How to use this
- Sellers in high-ratio cities: pricing at market is usually enough to create competition; judge agents on their local record, not promises. Each city link above goes to that city's agent hub with its own market snapshot.
- Buyers in low-ratio cities: the data supports negotiating — especially on listings that have already taken a price cut.
- Everyone: city averages hide ZIP-level variation. Drill into the ZIP pages on any city hub before setting a strategy.
Keep reading
The $48,000 Mistake: What a Price Cut Costs a California Seller
Closed-sale data on what a price cut really costs California sellers — how much longer cut homes take, how far below asking they close, city by city.

How Long Homes Take to Sell in California, by Price Range
Average days on market, sale-to-list ratios, and price-cut rates across five price bands, computed from closed California sales.

How to Price Your Home to Sell Fast (and for More)
A data-backed method for setting your list price: what priced-right homes have in common, why small cuts don’t fix big misses, and the three-week rule.
Skip the guesswork
Get matched with agents who know your city's market — free, based on their closed-sale record.
Frequently asked questions
What does a sale-to-list ratio above 100% mean?
Homes in that market typically sell above the asking price — multiple-offer conditions. South Pasadena leads our data at 105.3% across 317 sales in 24 months.
Where do buyers have the most negotiating room in California?
Markets with sale-to-list well under 100% and high price-cut rates. In our data, Joshua Tree closes at 92.6% of list with 40% of listings taking a price cut.
Should sellers automatically price low in a hot market?
No — but hot-market data means a market-priced listing will find competition on its own. Deliberate underpricing is a strategy decision to make with an agent whose own sale-to-list record you have checked.